Abstract
Note-level automatic music transcription is one of the most representative music information retrieval (MIR) tasks and has been studied for various instruments to understand music. However, due to the lack of high-quality labeled data, transcription of many instruments is still a challenging task. In particular, in the case of singing, it is difficult to find accurate notes due to its expressiveness in pitch, timbre, and dynamics. In this paper, we propose a method of finding note onsets of singing voice more accurately by leveraging the linguistic characteristics of singing, which are not seen in other instruments. The proposed model uses mel-scaled spectrogram and phonetic posteriorgram (PPG), a frame-wise likelihood of phoneme, as an input of the onset detection network while PPG is generated by the pre-trained network with singing and speech data. To verify how linguistic features affect onset detection, we compare the evaluation results through the dataset with different languages and divide onset types for detailed analysis. Our approach substantially improves the performance of singing transcription and therefore emphasizes the importance of linguistic features in singing analysis.
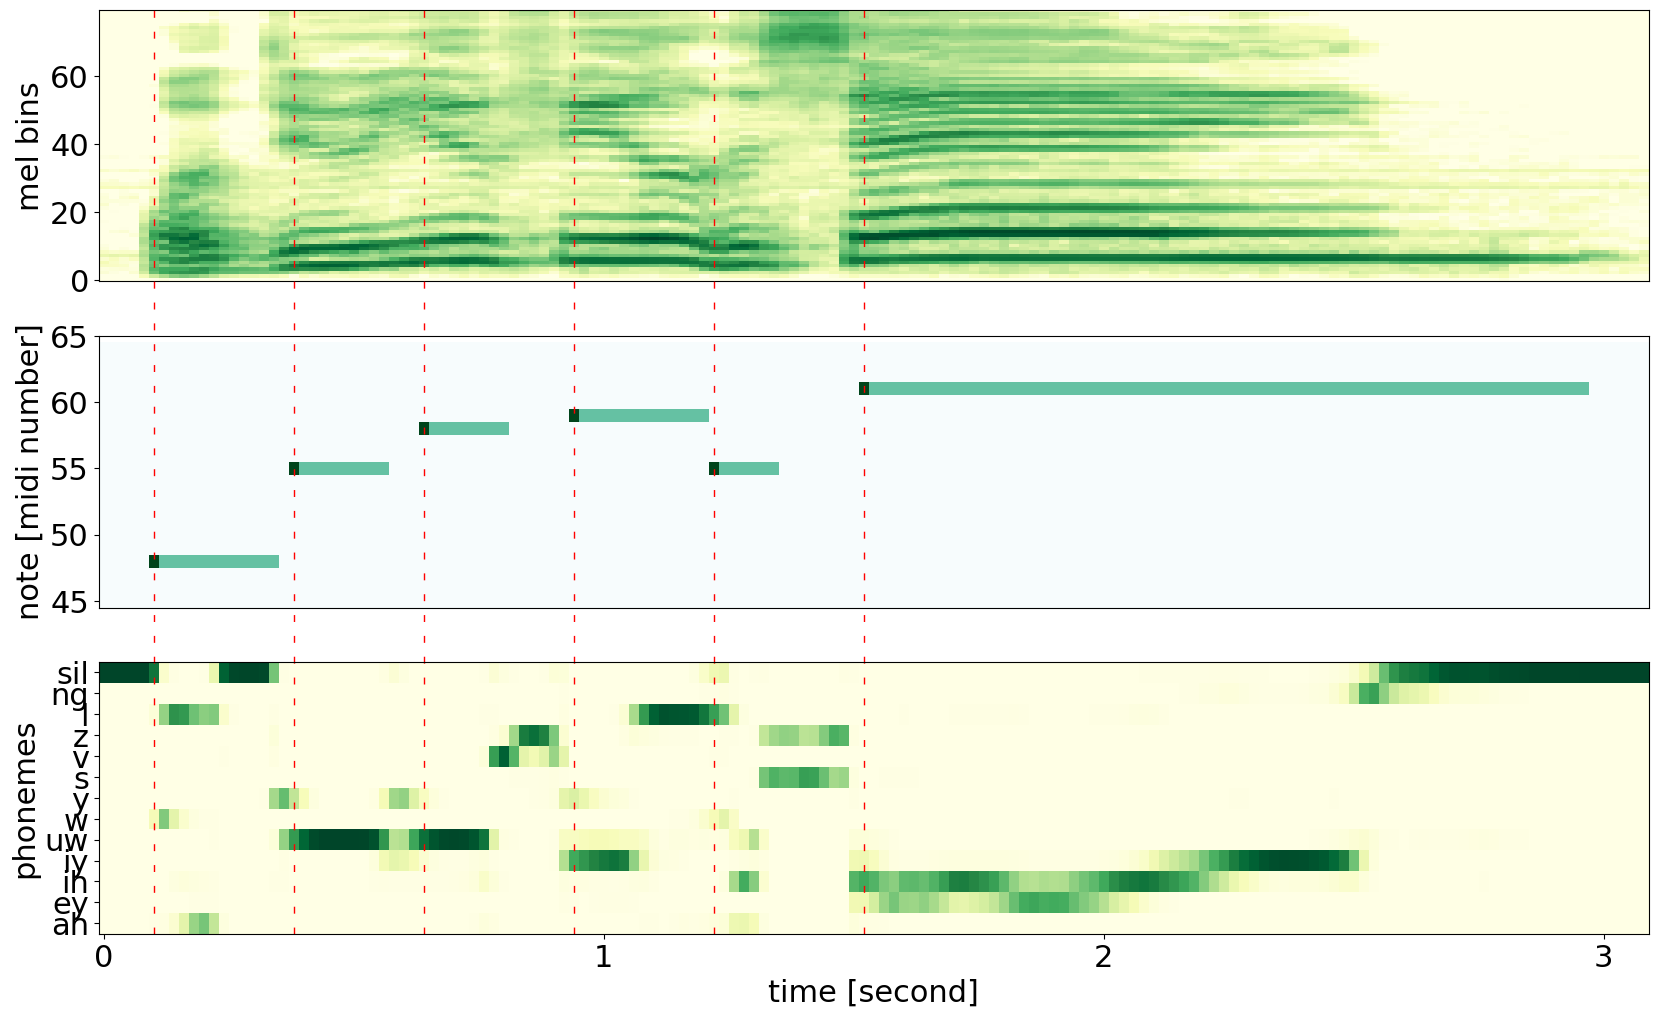
 Figure 1. An example of singing voice: mel-spectrogram (top), piano roll with onsets and pitches of notes (middle), and phonetic posteriorgram (PPG) (bottom) from singing (phonemes with probability under 0.5 in this example were omitted).
Model Architecture
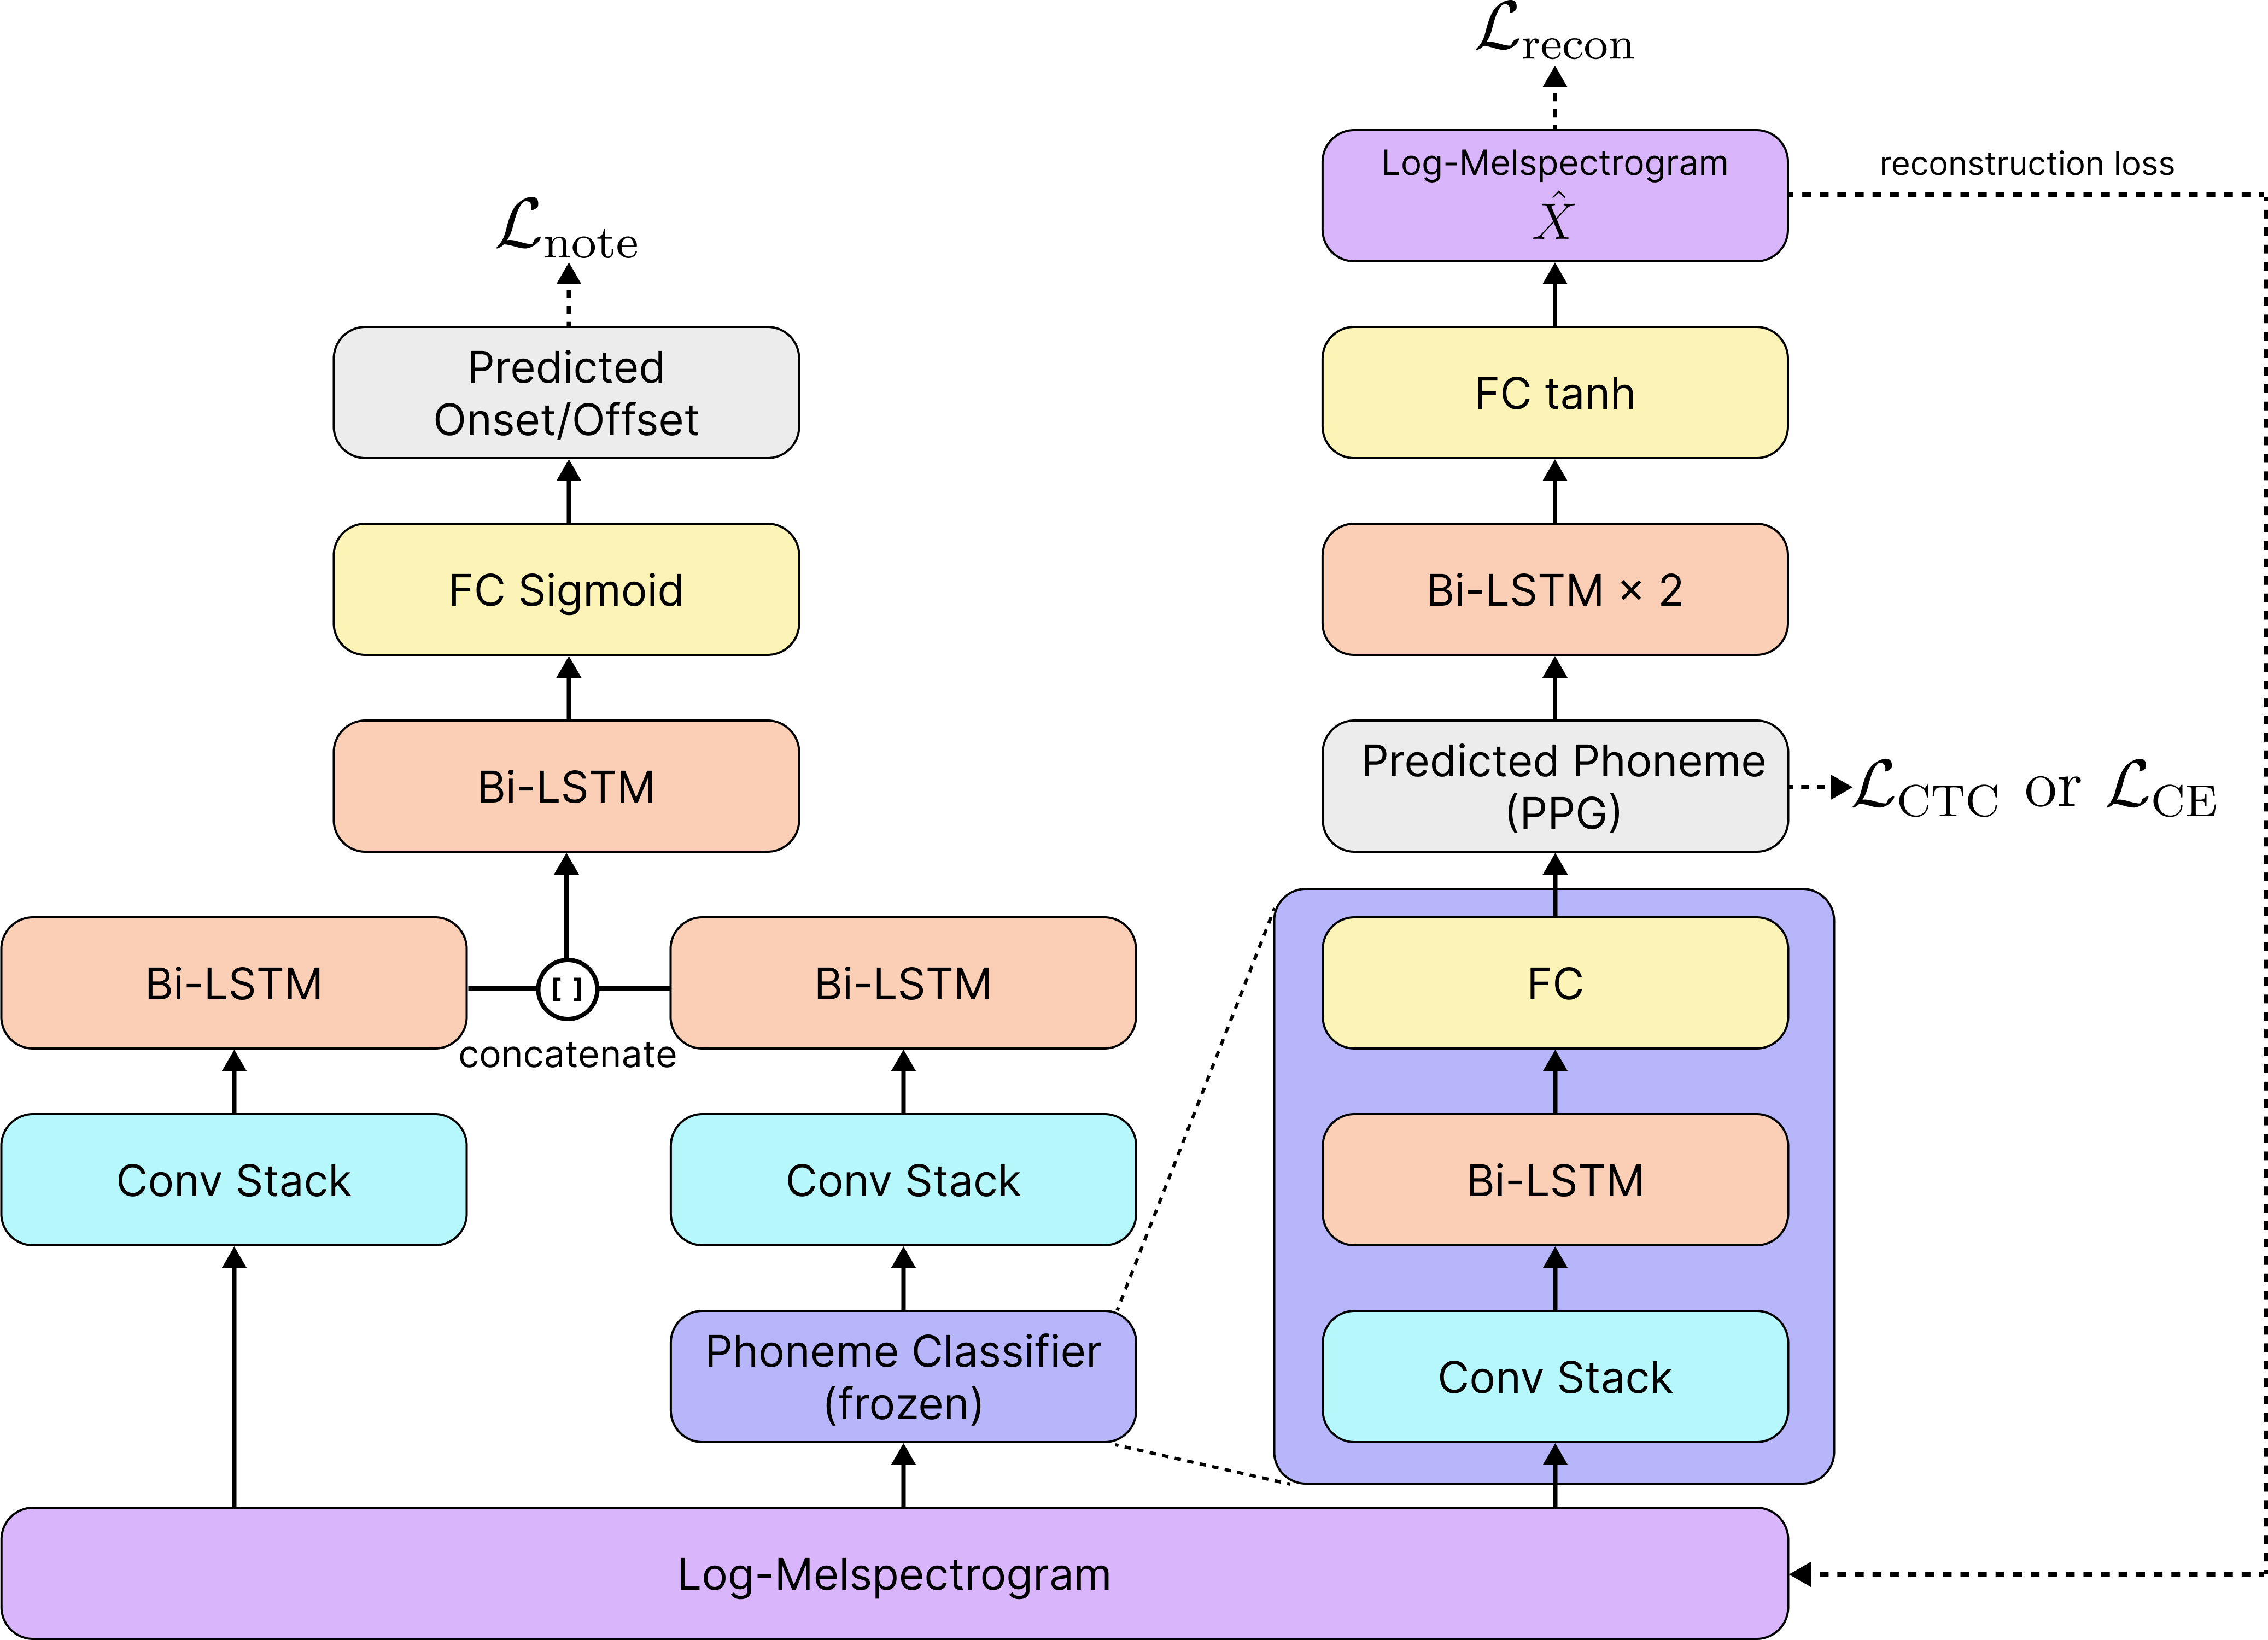
 Figure 2. The proposed model architecture
Evaluation
Ablation Study
 Table 1. Onset/Offset detection results from various neural network architectures with two input features. X and P^ denote mel-spectrogram and PPG, respectively. (g) corresponds to the neural network architecture in Figure 2.
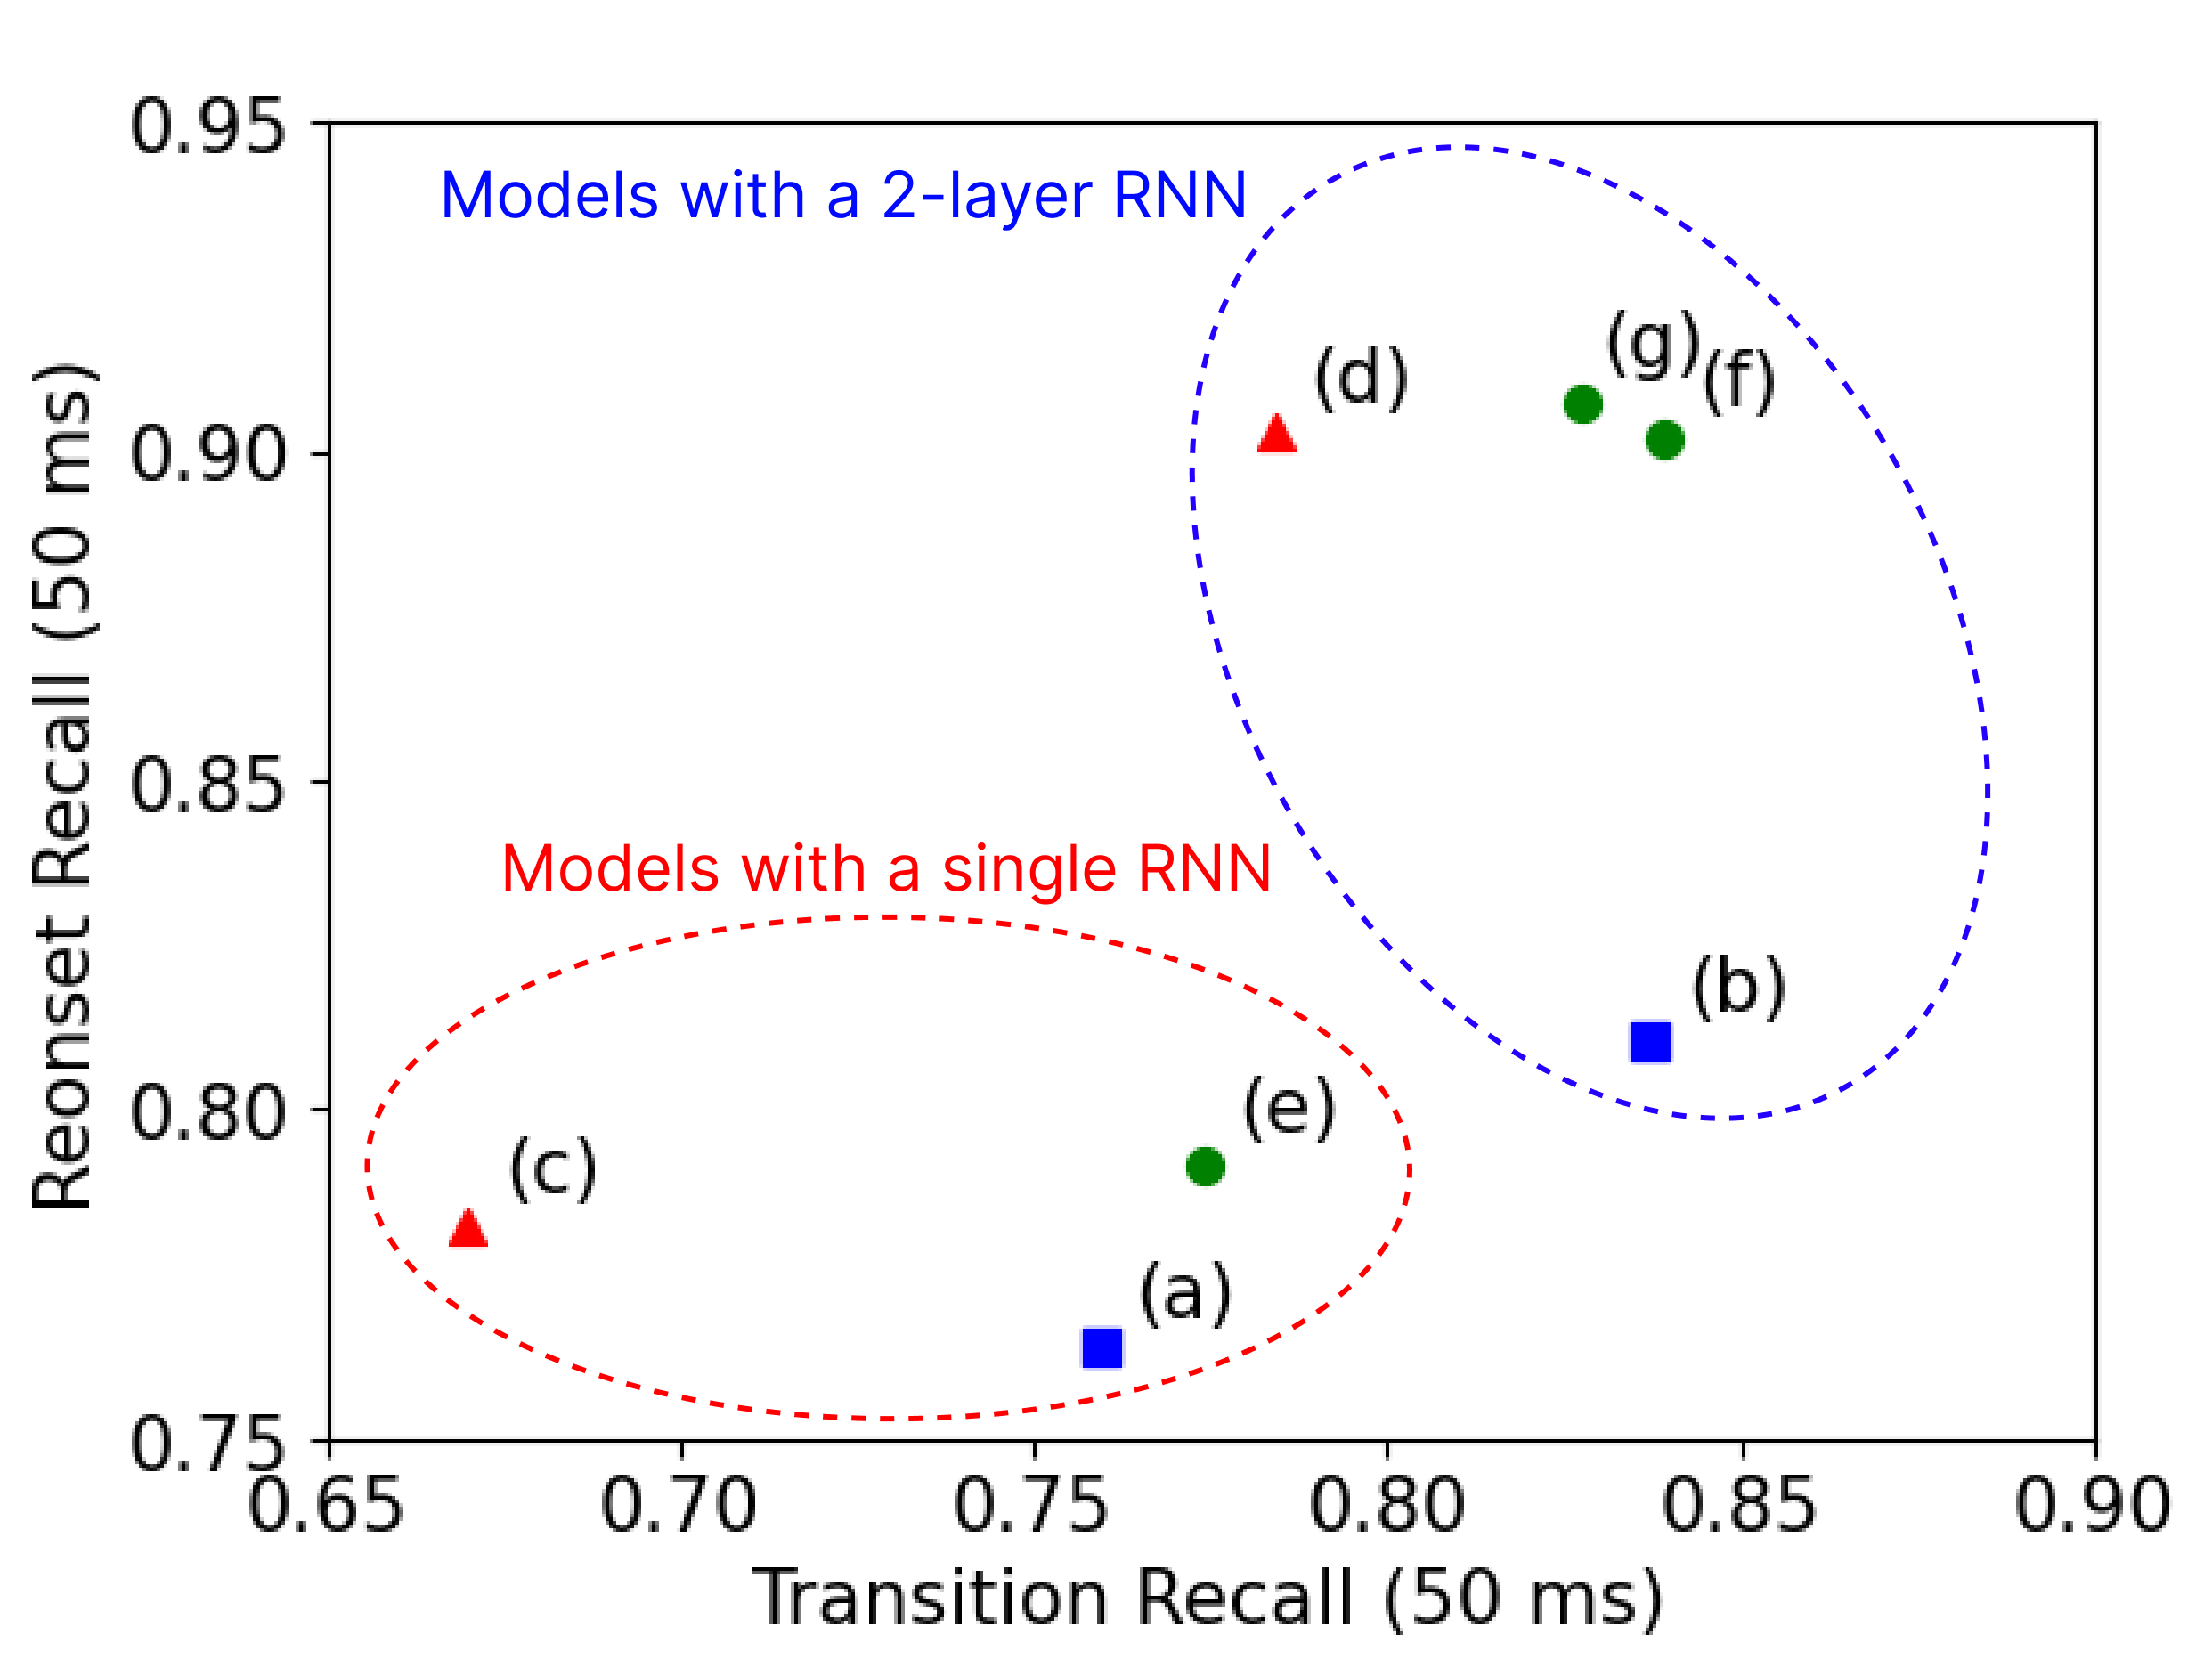
 Figure 3. Transition and re-onset recall of the models in the ablation study on ISMIR2014. The red triangle is the model with mel-spectrogram, the blue square is the model with PPG, and the green circle is the model with both features.
Note that re-onsets and transitions are note onsets which have 20 ms or less apart from the offset of the previous note. The difference between the two types is whether the pitch changes (transition) or not (re-onset).
Demo Examples with Visualized Features
In the plot, the first two subplots are mel-spectrogram and PPG with softmax each. The third subplot is the ground truth piano roll. The fourth, fifth, and sixth subplots are the raw prediction of the network with mel-spectrogram ((b) in Table 1), PPG ((d) in Table 1), and both features ((g) in Table 1). In the raw prediction plots, red lines indicate the onset, blue lines indicate the offset, and green lines indicate the activation. Red and blue vertical dashed lines indicate the ground truth onset and offset, respectively, and the black dashed horizontal lines indicate the threshold for onsets and offsets.
Examples with Transition Notes
Note that transition notes are not detected well with PPG, but well detected with mel-spectrogram. The orange-colored box is where the model with PPG cannot detect the onset.


Examples with Re-Onset Notes
Note that re-onset notes are not detected well with mel-spectrogram, but well detected with PPG. The orange-colored box is where the model with mel-spectrogram cannot detect the onset.

